Without a doubt, one of the more shocking revelations from the 2015 stock market correction is how sharply crude oil prices are rebounding. Just when you turn your back on the seemingly endless sea of red in this sector, it begins to perform during one of the most stressful periods of the last three years. That counterintuitive psychology is what makes investing so difficult and at the same time quite alluring to those of us who follow the market’s fickle machinations.
The United States Oil Fund (
) is an exchange-traded fund that tracks the daily price movement of West Texas Intermediate Light Sweet Crude Oil futures contracts. This fund has $2.9 billion in total assets and a total expense ratio of 0.72%.
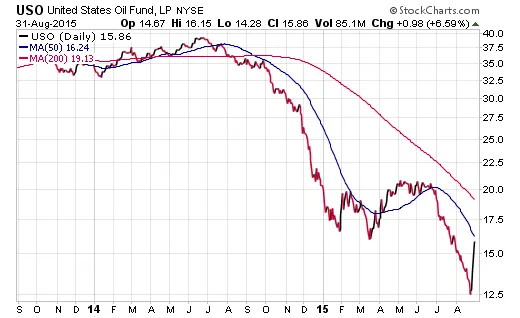
To recap, USO hit a fresh 52-week low on August 24. This was the day before the 1,000 point decline in the Dow Jones Industrial Average and much of the commodity capitulation was lost amongst the angst in stocks. Yet over the last five days, this liquid commodity ETF has managed to string together a consecutive winning streak in excess of 27%.
The chart below depicts the jump as one of the sharpest in the last two years and many chartists have been swift to point out that oil is now breaking out of its most recent down-trend.

This same rally has been mirrored in energy stocks as well. The Energy Select Sector SPDR ETF (
) is dedicated to tracking a market cap weighted index of 42 large-cap consolidated energy companies. This include well-known names such as Exxon Mobil (
), Chevron Corp (
), and Schlumberger NV (
).
At the lows of the year, XLE had been down as much as 23% in 2015 as crude oil prices continued their rapid descent. Nevertheless, over the last week, XLE has jumped over 10% from its lows and is continuing to show relative strength in this seemingly disjointed stock market.

It’s no surprise that XLE generally carries a high correlation to the underlying trend in crude oil and natural gas futures contracts. The profits in the companies that make up this diversified ETF are heavily tied to the differences between their fixed costs to extract the commodity and their ability to deliver it to the global marketplace.
From a fundamental perspective, there is an argument to be made that big oil companies are trading at tremendously attractive valuations. Charles Sizemore, of the Sizemore Insights blog, pointed out that the price/book ratio of the top XLE holdings are trading near the lowest levels of the last decade and a half. These stocks are going to create a great deal of interest from value investors looking to capitalize on low relative balance sheet ratios rather than recent price momentum.
The fund flows from ETF investors may be indicating belief in a rebound as well. Since the beginning of the year, USO has accumulated $2.02 billion in new assets, while XLE has gained $2.32 billion. This money certainly hasn’t been chasing performance, but rather looking to capitalize on a counter trend rally. The difficulty of course is timing when that event will materialize and how convincing the rally will ultimately be.
The Bottom Line
There is no way to say for certain whether energy prices have formed a sustainable bottom after months of vicious selling. This rally could be a quick round of short-term buying that ends in another test of the lows or the start of a new long-term uptrend.
After months of punishment and extreme bearish sentiment, there are plenty of reasons to be cautious in the energy patch. It’s worth remembering that cheap valuations can always get cheaper. Yet, those same aforementioned weaknesses may work in favor for the bulls that are looking to establish dominance in a sector that is primed for a comeback story.
